Google Analytics: Gaining Actionable Insights on Content Marketing Conversion Goals. Conversions: This is where all the goal conversion data in GA lives. Actionable Analytics Google Analytics provides lots of data that can be segmented and viewed in a nearly infinite number of ways. This is why GA allows you to overlay goal completions on top of the Audience, Acquisition, and Behavior views. Viewing Location Conversion Data in GA Looking at the Audience traffic by location as an example (Audience > Geo > Location) the data table can be amended to show how a goal performed against it. Viewing data in this way can be a challenge, however, which is why GA has some powerful data visualization options just above the conversions table: Each one of these table helps to visualize the data in a different way, and can be a valuable way to view large sets of data to see trends. When selecting this view, we can see goals completed by location in a more visual way: The only caveat to this data view is that it only shows total completions and not the rate. Google Analytics is a giant pivot table, so there are times when it’s just easier to sort the table, and we can do exactly that with goal completions as well: Just be sure to look at the visit volume when doing this because as we see above, Nicaragua was a powerful performer, but with a total visit volume of just 16 it’s hard to take as a true result. At any data page in GA, you’ll see an option at the top that shows “All Users,” and also the option to create a new segment: Typically, when creating a custom segment, marketers will segment their audience by traditional metrics such as demographic, geographic, or technological, but it also allows for more custom ones, and that’s what we’ll use. The result is a view that will only show the data for people who completed goals, and can give you a powerful view into the traffic of most value to you.
More than ever, marketers need to determine content marketing ROI.
Google Analytics (GA) is an ideal place to start. Setting up GA to track goals is an important first step to measuring content marketing effectiveness. By defining and tracking conversions on your blog, you’ll gain powerful insights into how your content is driving visitors to take actions that matter to your business.
In my previous post on this topic, we went through how to set up conversion goals in GA. This ensures that you’re recording clean data.
If you’ve done that and are ready to gain deeper insights, then look no further. In this post, we’ll go through a few examples of reporting and analysis that will help you to act on the conversion goals you’ve set in your GA instance. (If you’d like to dig even deeper into this topic and see live examples of everything in this post, check out our recent webinar.)
Quick Overview of Google Analytics Reporting Categories
If you’re not the primary user of GA, it’s important to understand the basic ways in which GA views and reports on data. While there are many ways to look at data, GA reports on four major buckets:
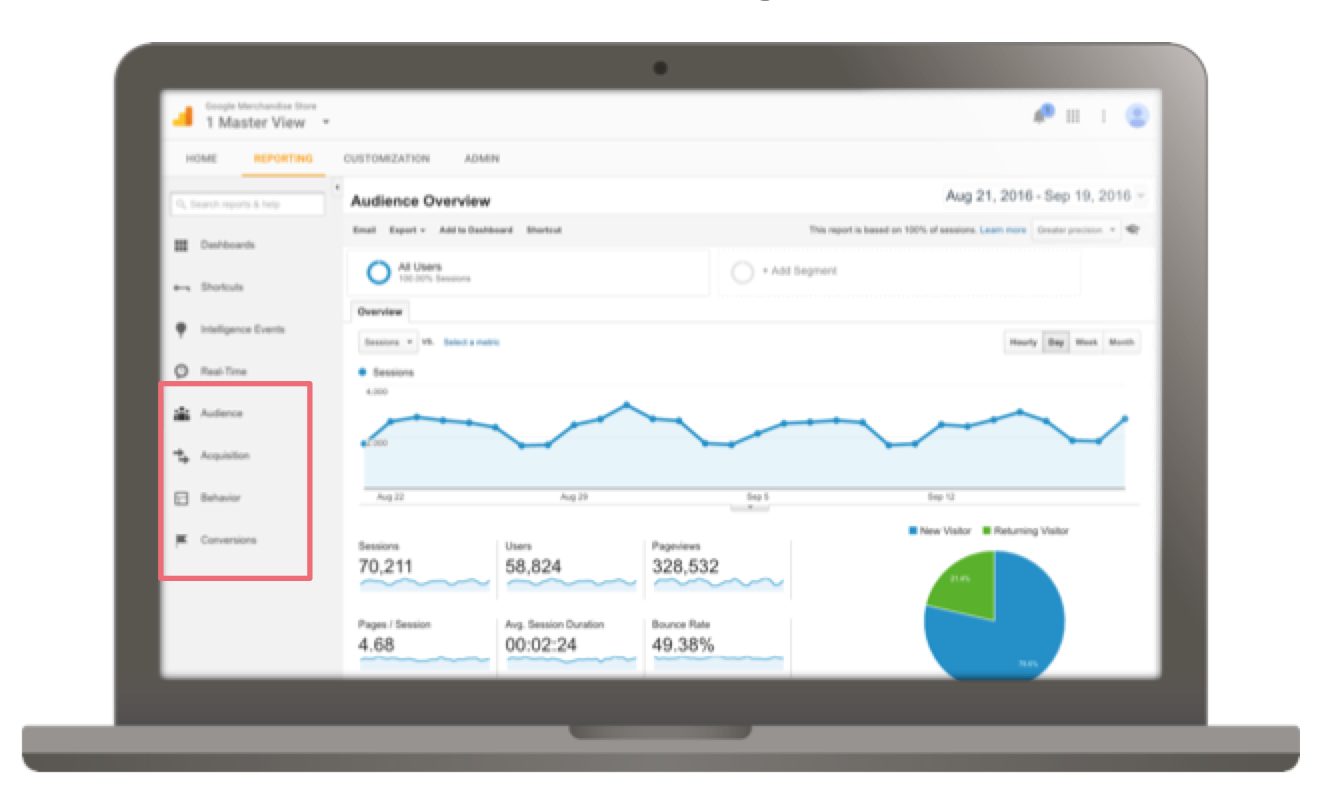
- Audience: This is the ‘who’ of GA, covering all the information about people who visit your hub, from geographic locations, demographic categories, and even what devices they’re using.
- Acquisition: Here, we learn how people got to your site via different channels, social networks, and referral sources.
- Behavior: This category covers everything visitors do when they get to your site; this includes pages visited, what types of content they viewed, time on site, paths taken, and much more.
- Conversions: This is where all the goal conversion data in GA lives. Much of the information that we’ll be looking at today comes from this area, where we’ve set up custom goals.
With that covered, let’s dig into the actual data to discover some insights that will help inform and shape your content marketing strategy.
Actionable Analytics
Google Analytics provides lots of data that can be segmented and viewed in a nearly infinite number of ways. If you’re already using a content marketing platform or marketing automation software platform, you may occasionally feel analysis paralysis. Because you have so much data at your disposal, it’s critical that your analytics are actionable.
So what exactly does that mean?
Valuable analytics means that you can easily understand your data, articulate it to others, and take action.
This is the core of what we’re looking at today. Everything in this article is designed to help you understand your audience better, and use that data to inform your strategy and spend.
If you’re just recording the goals that are being completed on your hub, you’re gaining valuable insight into whether things are working. But it doesn’t give you much that you can alter or test to improve these metrics. This is why GA allows you to overlay goal completions on top of the Audience, Acquisition, and Behavior views. Seeing goals completed isolated into these views allows you to look at your audience through a very specific lens and determine: What it is about your traffic that converts into goals?
For each of the first three major GA buckets above, there are some key metrics that you should be viewing your goals against, and we’ll dig into a few of these specifically later. Depending on your business model there may be others, but the below will start you off with a good core group to keep as your reference points when you audit your content performance:
Audience |
Acquisition |
Behavior |
|
|
|
To show the value of GA goal comparisons, we’re going to dig into one example. Here, you’ll see how you can parse through audience conversion data to gain better insights on your customers.
Viewing Location Conversion Data in GA
Looking at the Audience traffic by location as an example (Audience > Geo > Location) the data table can be amended to show how a goal performed against it. This is the critical component that allows us to not only see how visitors got to the site, but also how each location performed against a goal independently.
On the far right of your default table, you’ll see an option to change the conversion. For this example, we’ll use the Purchase Completed goal that comes from the dummy data account from Google. As you’ll see, the overall conversion rate is 2.75% across all countries:
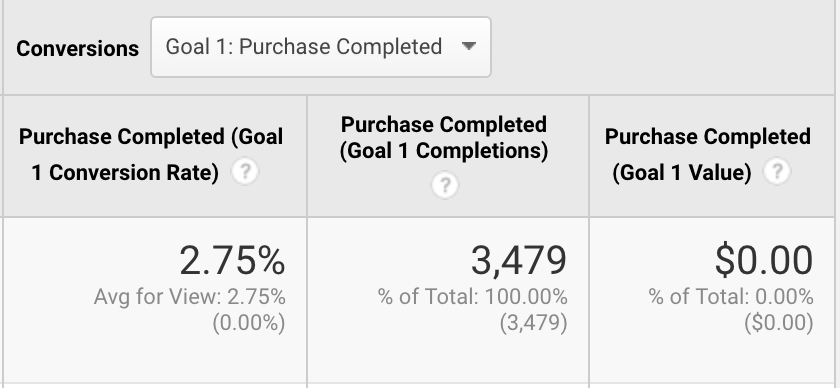
However, this view also shows the conversion…
COMMENTS