![The Other Side of Retail: Post-Holiday Returns and Exchanges [Infographic]](http://www.marketinghub.today/wp-content/uploads/2018/01/the-other-side-of-retail-post-holiday-returns-and-exchanges-infographic.jpg "The Other Side of Retail: Post-Holiday Returns and Exchanges [Infographic]")
Shoppers may prefer to purchase from the comfort of their own homes, but many would rather make returns in person. And those returns add up: Nearly 25% of customers return or exchange at least one holiday gift, and total holiday returns from 2016 totaled over $69 billion. Those stats—and many more—come from an infographic by digital commerce consultancy SUMO Heavy. The graphic explores what types of items people return, why they choose to return things, how they prefer to make returns, and what all that means for retailers. One thing retailers need to consider is preparation. Nearly two-thirds of people prefer to return items in-store rather than online, so retailers should be staffed accordingly. However, that customer preference also presents opportunities for retailers. Giving customers a good return experience can entice them to shop in the future, and salespeople can promote alternative return options, such as gift cards or store credit, instead of cash. To see more about what customers are returning and how retailers can prepare, check out the infographic:

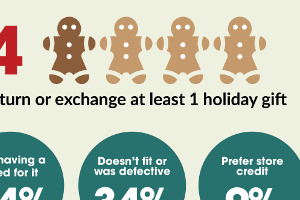
Shoppers may prefer to purchase from the comfort of their own homes, but many would rather make returns in person. And those returns add up: Nearly 25% of customers return or exchange at least one holiday gift, and total holiday returns from 2016 totaled over $69 billion.
Those stats—and many more—come from an infographic by digital commerce consultancy SUMO Heavy. The graphic explores what…
COMMENTS