View your total number of page likes in Facebook Insights. Go to the Posts tab under Insights to view your Facebook followers’ daily activity. To find this information in your analytics, click the Tweets tab at the top of the page. The Tweets tab shows engagement data for your Twitter account. #3: Track Likes and Reactions for Your Posts Gauging how your audience reacts to the content you post and share is crucial for any marketing strategy. View engagement data for your Facebook posts. To find this data in your analytics, click the Tweets tab at the top and scroll down to view your tweets. Twitter On Twitter, your analytics data provides audience information related to your followers. Look at Reach data in your Facebook Insights. You can view post reply counts in your Twitter analytics.

how to
Do you want to measure the impact of your social media marketing
efforts?
Wondering which social media metrics you should focus on?
Analyzing the raw data on campaign performance helps you
determine which tactics are working.
In this article, you’ll discover the top 10 social media
metrics you should be monitoring on Facebook and
Twitter.
#1: Track Follower Growth
Your total count of fans, followers, and page likes represents
the number of unique people who have taken an interest in your
business. Ideally, you should
consistently grow your following. This means the content you’re
sharing and the ways you’re engaging your audience need to be
enticing enough to attract new fans.
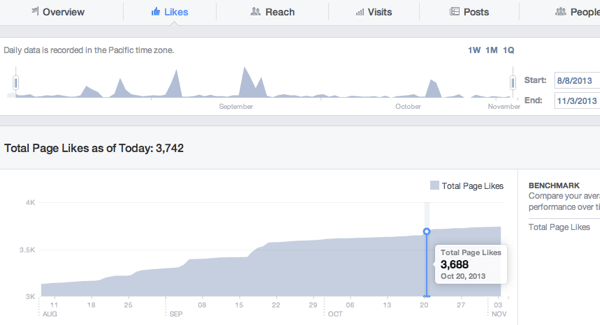
On Facebook, it’s easy to get a detailed analysis of
your number of page likes. Go to your
page and click the Insights tab. Then
click Likes in the left navigation.
You’ll see your total likes, as well as gains and losses of
likes over a designated time period. This lets you monitor
your audience’s reactions to certain posts or
determine which time periods are best for bringing in new
fans.
Insights.
On Twitter, you can find your follower count on your
Twitter account page.
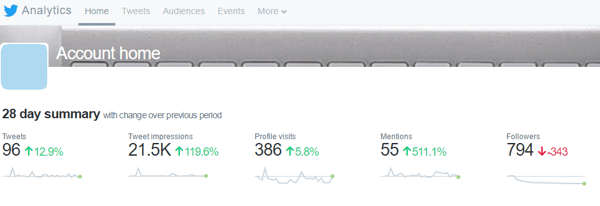
To view trends and statistics for your
followers, visit Twitter Analytics. Click
on your profile picture at the top right of any Twitter
page and choose Analytics from the drop-down
menu.
statistics for your Twitter followers.
The data at the top of the page shows a continuous 28-day
summary, with information on your followers on the far right. You
can see gain/loss trends for recent followers. Scroll down to see a
summary for previous months, which includes changes in
followers.
#2: Identify Optimal Times for Engagement
Knowing when your audience is most likely to engage with your
content is important. It helps you tailor your
strategy so you post your content at the right
time (when your audience is most active) and the best days
of the week.
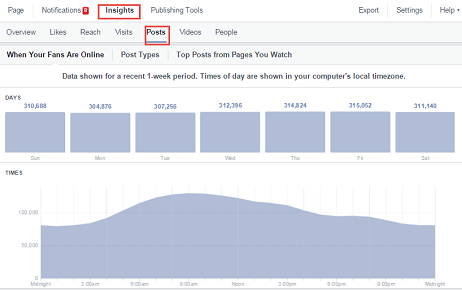
On Facebook, you can view your followers’ daily activity
over the last week. By narrowing it down to individual
days, you can see how engagement shifts by the hour.
On your Insights page, click Posts in the left
navigation and make sure When Your Fans Are Online is selected at
the top. Then hover over the different days of the
week (Sunday through Saturday) at the top of the Posts
tab.
Facebook followers’ daily activity.
Twitter data is a little less comprehensive, as it doesn’t
provide engagement statistics for specific times throughout the
day. However, you can still see how engagement rises and
falls by day over the last 28 days (default) or another
designated time period.
To find this information in your analytics,
click the Tweets tab at the top of the page.
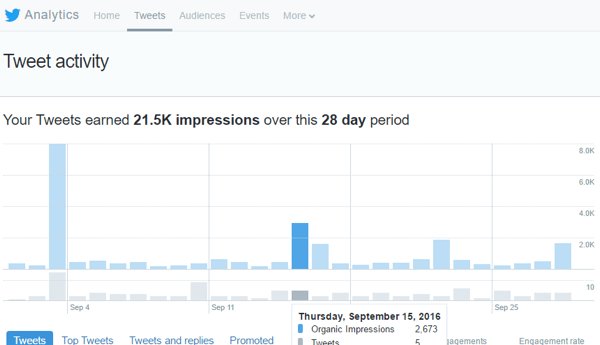
account.
#3: Track Likes and Reactions for Your Posts
Gauging how your audience reacts to the content you post and
share is crucial for any marketing strategy. This direct response
metric helps you determine whether your audience is
interested in what you’re currently
publishing, and should inform the type
of content you share in the future.
If your only engagement is chirping crickets on certain topics,
cut that content from your editorial calendar or send those
articles through another channel to a different audience segment
that might be more receptive.
Facebook provides more in-depth measurements with its updated
reaction system, which lets you know whether your fans like, love,
dislike, or are upset by something you shared.
To find this information, go to your Insights
page and click the Posts option in the
left navigation. Then scroll down to All Posts
Published and click on the right drop-down
arrow to view Reactions, Comments, and
Shares.
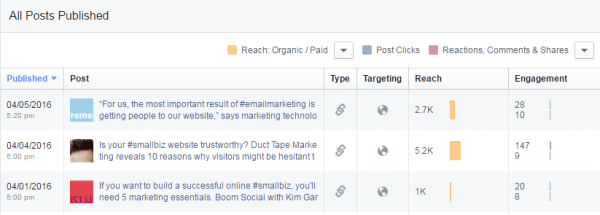
posts.
The data in the Engagement column measures the total reactions
for a post. If you want to see a more detailed look at a
post’s performance, click on the post
link to view the breakdown of reactions from your
audience.
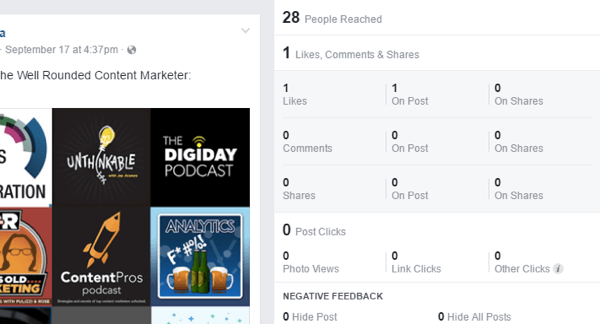
post.
Twitter has a similar approach and displays all of your tweets
for a selected timeframe. To find this data in your analytics,
click the Tweets tab at the top and scroll
down to view your tweets. You can also click Top
Tweets to view only your most popular tweets.
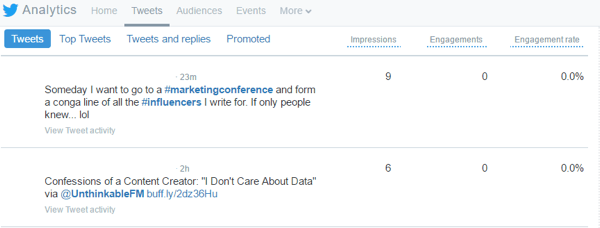
tweets.
The Engagements column on the right is helpful, but it includes
a lot of extra information…
COMMENTS