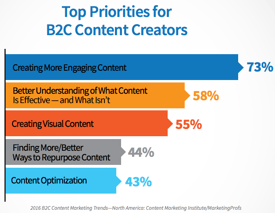
This year, we’ve seen the importance of visual content emphasized by the changes that occurred across almost every major social network, including Facebook, Snapchat, Instagram, and Twitter. At the same time, videos have become powerful tools for brands looking to communicate more easily with their readers.
To help you keep pace with these trends, let’s take a look at some marketing statistics that demonstrate the impact visual content has on reach, engagement, and sales. The stats are categorized by General Visual Content, Video, Emerging Visual Marketing, Infographics, and Social Media.
(Want to learn more about content creation, strategy, and promotion? Take our free Content Marketing Certification course.)
42 Stats You Should Know About Visual Content Marketing in 2017
General Visual Content Statistics
1) 37% of marketers said visual marketing was the most important form of content for their business, second only to blogging (38%). Tweet (Source)
2) 74% of social media marketers use visual assets in their social media marketing, ahead of blogs (68%) and videos (60%). Tweet (Source)
3) When people hear information, they’re likely to remember only 10% of that information three days later. However, if a relevant image is paired with that same information, people retained 65% of the information three days later. Tweet (Source)

COMMENTS