
You’ll then see a pop-up box with three data types to choose from: Page Data, Post Data, and Video Data. To start, select Page Data to download key engagement metrics for your page. Every file you download from Facebook has a Key Metrics tab. By examining the peaks in your post reach/impressions, you can see what type of content is popular, which helps inform your content strategy. Click the Lifetime Talking About This tab to see the number of comments, likes, and shares for each post for the time frame you downloaded. Why is this data useful? Looking at who clicked to play a video also informs your video content strategy. Unique, shows some basic metrics for any videos you’ve shared or uploaded to your page, including impressions, reach, and video views, as well as how many people watched 95% of your video. Video Views and Watches Take a look at the Video Metrics Total vs. Lifetime Total Video Views (column N) to see what percentage of people watched nearly to the end.
Want more information on how your Facebook audience responds to your marketing?
Looking for a guide to help you explore your Facebook Page Insights?
The data in Facebook Insights can help you learn what’s working and what’s not on your page.
In this article, you’ll discover how to download and analyze your Facebook Page Insights data.

Download Your Facebook Page Insights Files
Facebook provides a wealth of data and analytics for your business page. Delving into your insights can help you refine your Facebook page content strategy and improve engagement. So it’s worth taking some time to familiarize yourself with what data is available and the key stats to look at.
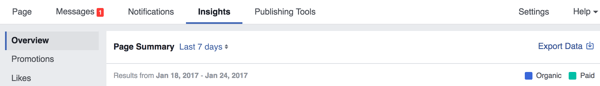
To download Facebook Insights for your page, go to your Facebook Page Manager on desktop and click Insights. On the Overview tab, click the Export Data link.
You’ll then see a pop-up box with three data types to choose from: Page Data, Post Data, and Video Data. To start, select Page Data to download key engagement metrics for your page.
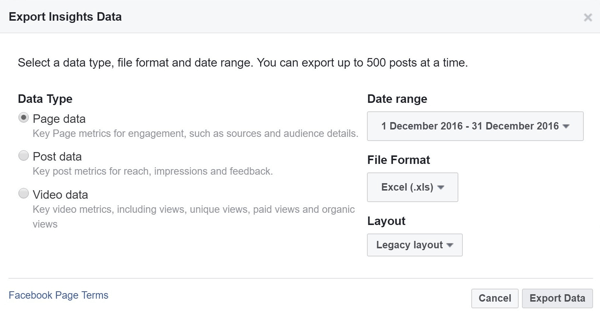
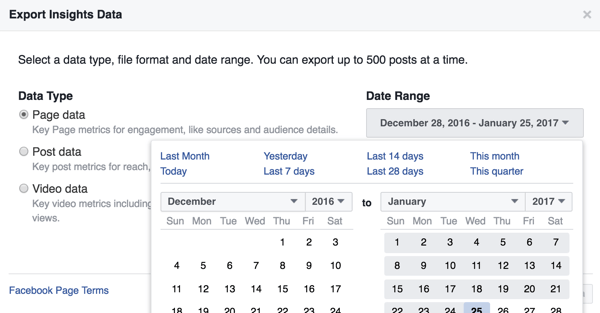
The default time frame is the last 28 days, but you can change the date range by clicking the Date Range drop-down menu. You can also select different layouts for the file, which will affect the versions of data and analytics that are downloaded. Your layout options differ depending on which data type you choose.
After you pick your data type, date range, and layout, click Export Data to start the download. You’ll see the message “Your download has started.” The export process may take a little while depending on the date range you chose.
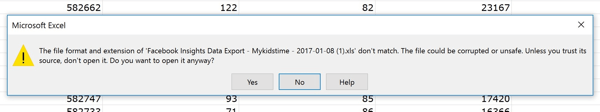
By default, the data will be saved in the Excel file format. Depending on the version of Excel you use, you may also get a message that the file format and extension of your filename don’t match. If you see this pop-up, click Yes to open your downloaded file in Excel.
So that’s how to access and download your Facebook Insights data files. You might want to do a monthly download of your data to save a copy offline. After all, you don’t own Facebook’s data analytics and you never know if they’ll switch off free access.
Now let’s take a look at the data you’ve downloaded and what metrics you’ll find there.
#1: Analyze the Page Data File
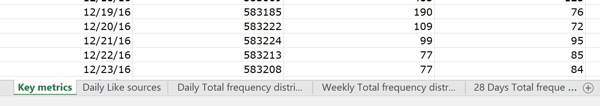
When you first open your Page Data file, you may wonder where to start. Every file you download from Facebook has a Key Metrics tab. Start with the Key Metrics tab because it summarizes the main metrics for your page. If you want more detail on any particular metric, click any of the other tabs to access additional sheets.
Here are a few tips to make it easier to view the data in your file:
- Freeze the top row so you can see the header and know what you’re looking at as you scroll.
- Add a total to all of your columns using the =sum() formula. Then copy this along your row so you have totals for the time period.
For starters, there are three key groups of page stats to look at. What you delve into beyond these depends on which metrics matter to your business. If you’re using Facebook to drive traffic to your website, for example, you should be looking into link click stats. If you’re focused on building a community, engagement can be a key metric to look at.
Likes and Like Sources
The Lifetime Total Likes column shows the likes for your page for the time period you chose for the download. It’s interesting to see if there were any peaks in likes on certain days.
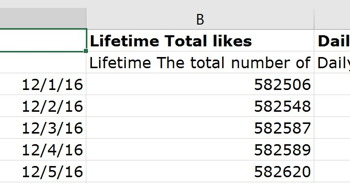
If particular days stand out, look at the posts you published on those days (you’ll be looking at Post Data stats later) to see if any posts received an especially good response. These posts may have earned you new fans.
Or perhaps a certain channel is bringing you extra likes. To see this information, click the Daily Like Sources tab. On this tab, you can see how many new likes came from page suggestions (when Facebook shows users related pages or pages that might be of interest to them). You can also find out how many page likes you gained from your Facebook ads.
Analyzing the growth in likes and the sources of fans for your page can help you determine content and channels where you should invest more time to attract new fans.
New Likes vs. Unlikes
Next, look at the Daily New Likes and Daily Unlikes columns on the Key Metrics tab. This data will tell you how many fans you’re gaining or losing.
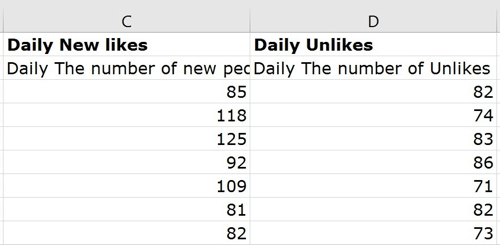
Total these two columns and then subtract the total unlikes to see the net gain or loss over the time period. You can also look at individual days to see if there were any spikes or drop-offs. Maybe there was a peak of unlikes one day and you want to understand what made people unlike your page. If you see a peak, look up the posts for that day and see if you can determine what turned people off.
While you can’t stop people from unliking your page, understanding unlike behavior informs your page content strategy, helping you minimize fan loss.
Video Stats
Each Page Data file has a ton of stats about video content and how users are interacting with it. Diving deep into your video stats can help you tweak your video strategy for your page.
Column BU (Daily Total Video Views) is the start of the video stats for your page.
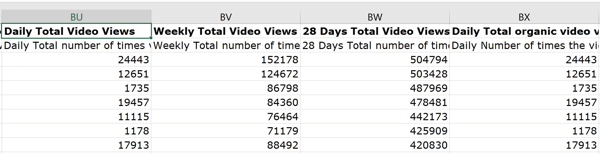
You can access all sorts of information about organic and paid video views, as well as views over 3 seconds. In column CJ, you’ll find an interesting stat called Daily Total Number of Times a Video Has Been Seen Again. You can see a daily total of the number of times a video has been seen when it’s not the first play; in other words, people came back to view the video another time.
Why is this interesting? It shows the stickiness of your video content. People were prepared to view it past the initial video play.
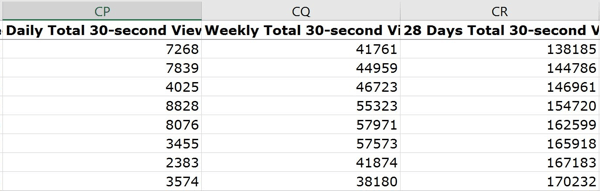
If you go to column CP (Daily Total 30-second Views), you’ll learn even more information about the people who viewed at least 30 seconds or to the end of your video. This data tells you how many people viewed beyond the initial 3-second time frame when they decide whether the content has value.
COMMENTS