
The Easel.ly website features an easy to follow guide on how to create content on their platform. The platform makes it easy to create custom infographics without any design experience. In addition to infographics, they have other design templates as well. You can build the right image for whatever you’re trying to illustrate. The platform allows you to fully customize every element of each infographic you create. But their infographic building tools are just as good, if not better. Once your image is uploaded, you can select a font from over 130 options. Creately Creately is a platform specializing in creating unique diagrams for your business. Even if you don’t want to publish your diagrams, you can use the tool for in-house projects such as building a customer journey map. You can use customized fonts and templates to create these unique images.
Those of you who have been reading my blogs for a while know I’m a huge advocate of using visual elements to enhance my blog posts.
In addition to being visually appealing, images can actually improve the performance of your articles. That’s because blogs with pictures receive 94% more views than posts without them.
According to a recent study from the Content Marketing Institute, 73% of marketers say their top priority is to create more engaging content.
And 55% of these content creators are prioritizing visual content.
If you haven’t been using images to enhance your content, you should consider starting with some infographics. Even if you have included pictures in some of your old content, you can take this strategy to the next level by building custom infographics.
That’s because infographics are a combination of text and images. Research shows people follow directions 323% better if the directions include both text and illustrations.
On social media platforms, infographics get liked and shared at three times the rate of all other content.
Once you start building infographics, you will drive more traffic to your website. That’s because other people will use your custom images to enhance their own content.
As a result, you will consistently build backlinks, which will improve your SEO.
Now that you understand why you need to create infographics, it’s time for me to show you how. There are tons of tools available, but not all of them are created equal.
I’ve narrowed down the top 12 tools for building infographics.
1. Easel.ly
If you want to create an infographic fast and efficiently, Easel.ly is a great place to start.
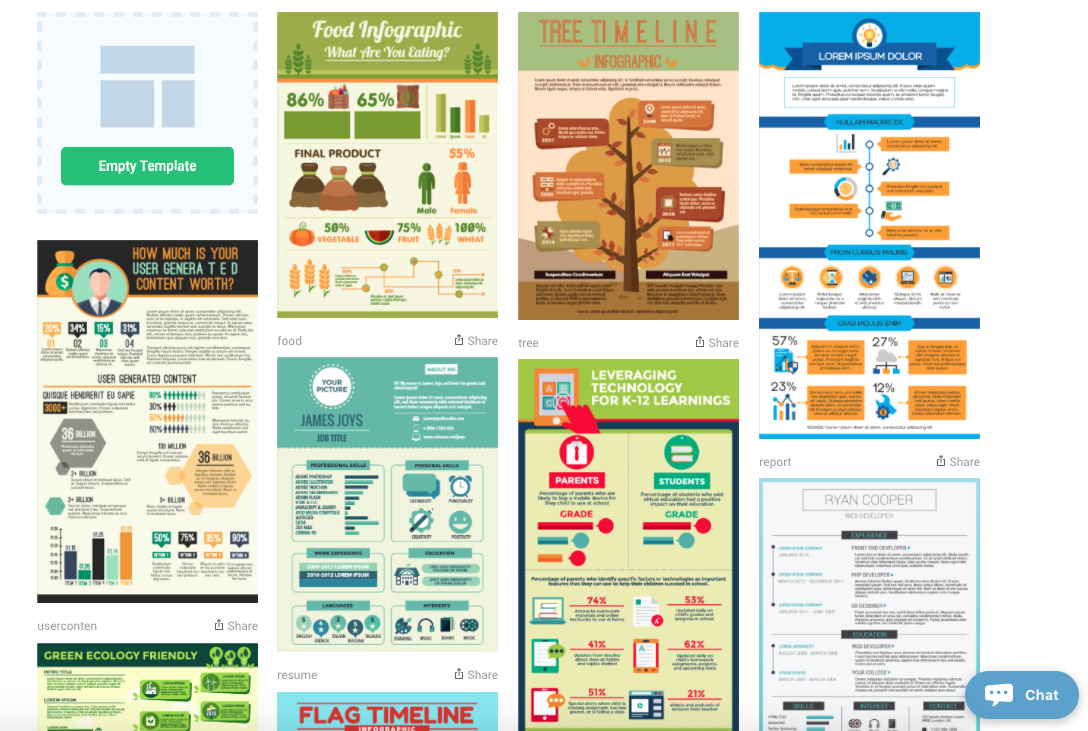
Above is a sampling of some of their top infographic templates. All you need to do is select the template you want and plug in your information.
They’ve got a template for everything. Some are designed to fit more text on the page, while others prioritize numbers from any research you may have conducted.
It’s free to use Easel.ly, but if you want premium templates, you can access over 500 of them for a fee. I recommend starting off with the free ones to see whether you’re happy with the platform before upgrading your membership.
Another cool feature of this platform is that they have community infographics built by others. You can plug your information into those as well.
The Easel.ly website features an easy to follow guide on how to create content on their platform. They also offer a live customer service chat option in case you have questions or run into any problems with the platform.
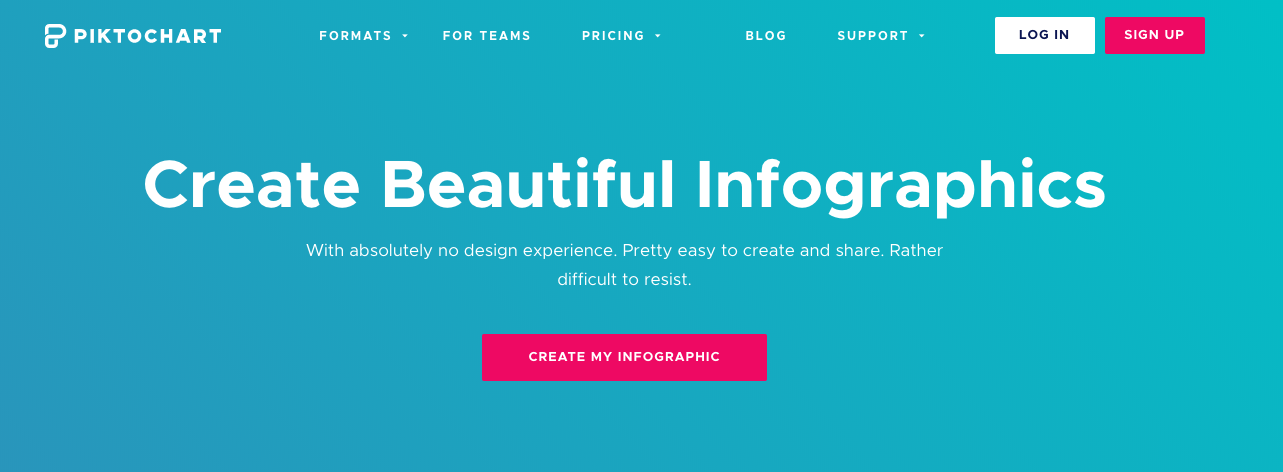
2. Pitkochart
Pitkochart is another top option for beginners. The platform makes it easy to create custom infographics without any design experience.
In addition to infographics, they have other design templates as well. You can build things such as:
- flyers
- posters
- presentations
- reports
Some of my favorite types of infographics on Pitkochart are the graphs. It’s a great way for you to display your numbers in a custom chart.
Pitkochart also has a map feature. You can customize the color options on these maps to show how different states, regions, or countries have varying results for your discussion.
Speaking of color options, Pitkochart has many. You can select colors for each portion of your infographic, or you can choose preset color schemes.
It’s an important feature because different color schemes can impact sales on your website.
They have a library of more than 1,000 icons. You can use these without having to pay licensing fees or give an attribution to the creator.
This definitely makes things less complicated, which allows you to spend your time and effort on building the infographics.
Once you build your infographic on Pitkochart, they help you name your image so that it’s optimized for SEO. Then, you can share it directly from the platform.
They have sharing options for email, ebooks, and social media. You can get an embedd link for your website, share it with your team, or download a high-resolution version of your infographic.
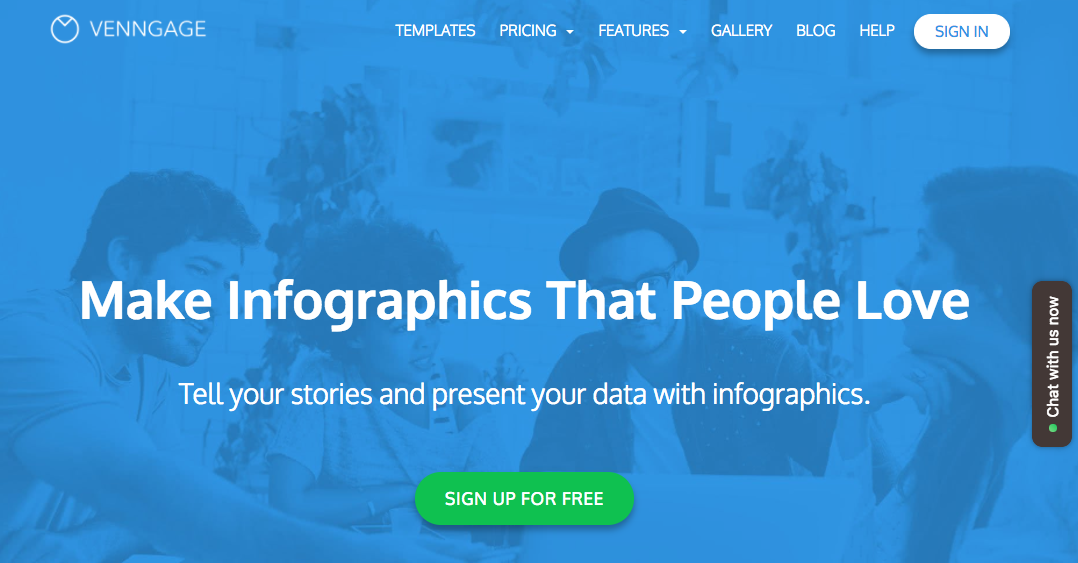
3. Venngage
Are you a student? If so, Venngage will let you use their software free. But everyone else will have to pay for the platform.
Their monthly rate is $19 for individuals and $49 for businesses. It may seem pricey, but the business membership comes with premium features such as:
- custom templates
- unlimited infographics
- 100 image uploads
- branding help
- charts
- icons
- team collaboration
- high-resolution downloads
If you know you want to take advantage of these features for the entire year, you can pay upfront annually and receive a 20% discount off your membership.
Venngage is great because their infographic templates are seemingly endless. With so many options, it’s less likely you’ll have similar to other infographics templates already published on the Internet.
This can make your brand stand out from the crowd.
They also group their infographics based on several categories. You can build the right image for whatever you’re trying to illustrate. Some of the top categories include:
- statistical
- lists
- timelines
- geographic
- real estate
- nonprofit
- human resources
They even have “fun data” templates to help you display your unique research in a way that’s easy to comprehend.
4. Visme.co
A list of visual design tools wouldn’t be complete without Visme.co. The platform specializes in all kinds of visual content, including infographics.
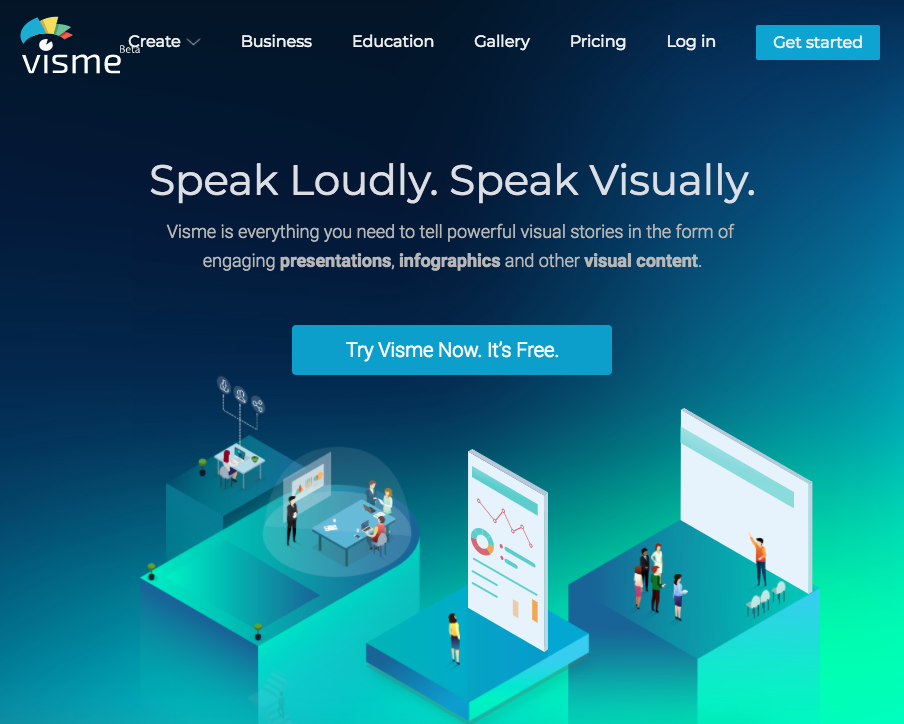
If you need to make an infographic that compares multiple variables, Visme.co has more than 20 charts and tables to choose from.
There are a couple of different ways you can input data into these visuals. Your first option is to type the numbers in manually. But if you have lots of information, you may prefer to import your data.
Another cool feature of these charts is the ability to connect with live data.
…
COMMENTS