
Take these steps for visualizing your strategies to become more productive in your (and your team’s) day-to-day life. Step 1: Visualize your high-level yearly goals It’s important to start at the end – identify the main goal your team should strive to achieve. It sets general expectations for the year and lays out the growth strategy with important metrics that could influence that goal. And setting deadlines and milestones is important for these projects too. It gives an immediate visual cue of start and end dates for each project. However, it is more complicated to fully comprehend when projects overlap or project steps are completed. A document or a spreadsheet outlining this information is overwhelming for management and individual contributors to understand. Step 3: Get individual team members to visualize their contributions We all know consistent reflection and journaling are great ways to remember and process new information. But documenting that information in a visual manner not only improves information recall, but it also can make it easier to organize your thoughts and ideas. In addition, all team members can see what their colleagues are working toward – holding every individual accountable for what they stated they would do.
Part of keeping people productive is ensuring that deadlines are set, but it’s not enough to simply state due dates. Employees need a constant and visual reminder of what needs to be accomplished and when it needs to be done.
You’ve probably heard it, but many studies prove visual cues can greatly increase the likelihood of information recall and comprehension of new subject matter.
Without being able to envision what that process looks like, it becomes difficult to fully comprehend what is required for success. Take these steps for visualizing your strategies to become more productive in your (and your team’s) day-to-day life.
Creating a visual of your strategy
I don’t know about you but when I get asked, “What’s the strategy for accomplishing x,” I immediately feel anxious.
It’s not because I don’t know the strategy, but because it’s such a broad question. The answer is not always straightforward. It’s silly of me to expect my team to remember a strategy I explain or email in text. It’s too overwhelming and too dense to fully retain.
I visualize every important component of the strategy so everybody is on the same page with a clear understanding of what’s expected of them and of the team.
Step 1: Visualize your high-level yearly goals
It’s important to start at the end – identify the main goal your team should strive to achieve.
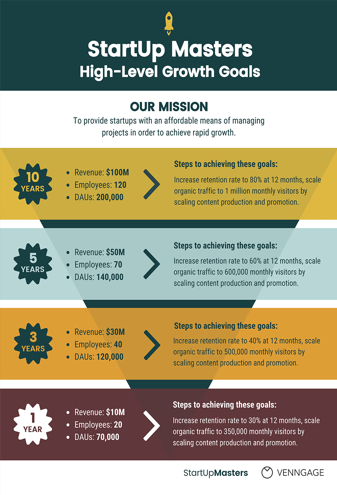
I like to start with a template or outline like the image above. It sets general expectations for the year and lays out the growth strategy with important metrics that could influence that goal.
The high-level growth goals for the hypothetical StartUp Masters – which has a mission of providing startups with an affordable means of managing projects in order to achieve rapid growth – are clearly shown. The goals are broken down to depict success in year 10, five, three, and one.
Not only are the year-specific goals highlighted, but each includes the factors that will influence revenue and daily active user numbers.
Print your goals and post them around your workspace or office so everybody is clear on the company’s targets.
Step 2: Identify and plot projects on a visual road map
Now, you need to show your team how they might get to those high-level goals.
Chances are your strategy incorporates projects that will influence the metrics that matter. And setting deadlines and milestones is important for these projects too.
Here’s an example of a basic product road map:

Each team’s projects are detailed by quarter. It gives an immediate visual cue of start and end dates for each project.
In this example, the web team can see that the new admin console must be completed by the end of January,…
COMMENTS