
We need consumer science to get there.” Reed’s aspiration was that the Netflix team would discover what delights customers through the scientific process — forming hypotheses through existing data, qualitative, and surveys, and then A/B testing these ideas to see what works. I found that consumer science — the scientific method of forming hypotheses, then testing them — is the best way to build a culture of customer obsession and to discover what delights customers in hard-to-copy, margin-enhancing ways. This exploration of cancel rates helped form a new hypothesis about how to improve retention. Boise had launched a few years later and its cancel rate was slowly approaching San Jose’s rate. Disk delivery speed improved from three days to overnight and led to lower cancel rates. We also tied our inventory system to the website’s merchandising system and only displayed titles on a member’s site if the DVD was available to ship the next day from that member’s local hub. We executed the A/B test, and “Previews” did not improve retention, margin, or other proxy metrics. Survey data When I joined Netflix, I was wary of surveys. Cancel survey. At Netflix, good ideas came from everywhere — via existing data, qualitative, survey data, and past A/B test results.
Nir’s Note: This guest post is by Gibson Biddle, former VP at Netflix and CPO at Chegg. Gibson is speaking at the Habit Summit in San Francisco on April 11th.
In 2005, as I joined Netflix as VP of Product, I asked Reed Hastings, the CEO, what he hoped his legacy would be. His answer: “Consumer science.” He explained, “Leaders like Steve Jobs have a sense of style and what customers seek, but I don’t. We need consumer science to get there.”
Reed’s aspiration was that the Netflix team would discover what delights customers through the scientific process — forming hypotheses through existing data, qualitative, and surveys, and then A/B testing these ideas to see what works. His vision was that product leaders at Netflix would develop remarkable consumer insight, fueled by results and learning from thousands of experiments.
During my time at Netflix, and later at my next startup, Chegg, I learned to move from customer focus to customer obsession and to embrace Reed’s notion of consumer science. Here’s how I think about the transition:
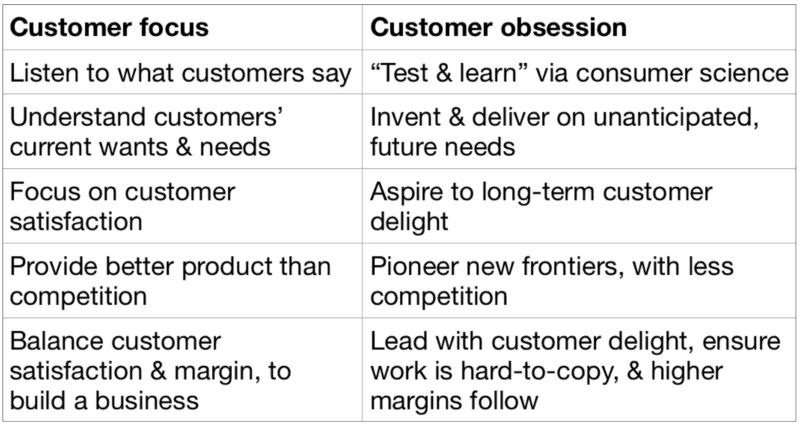
Over the years, my focus shifted from “What do customers say?” to the “Let’s test it!” mentality of consumer science. My team’s consumer insight improved, learning accelerated, and we developed stronger hypotheses about what would delight customers.
Here are the research techniques we used and how they contributed to both consumer science and customer obsession:
- We used existing data to understand past and current behavior.
- We did qualitative — focus groups, one-on-ones, usability — to hear how people think and react to our work.
- We executed surveys to capture who the customer is and how to think about them — by demographics, by competitive product usage, entertainment preferences, etc.
- Then we A/B tested the hypotheses formed via the above inputs to see what worked.
For me, customer obsession means a healthy preoccupation with customers’ unanticipated, future needs through a mix of research techniques that put the customer in the center of everything you do, so that you begin to see the product through their eyes. I found that consumer science — the scientific method of forming hypotheses, then testing them — is the best way to build a culture of customer obsession and to discover what delights customers in hard-to-copy, margin-enhancing ways.

My introduction to Netflix’s data-driven approach began with a Monday morning e-staff meeting where we looked at “e-staff metrics.” Fifteen executives sat in the room, sifting through data, asking questions. The metrics measured retention, revenue, and cost, but just as important, customer behavior changes. We kept a keen eye on the metrics and looked for unexplained changes.
In the spring of 2005, the metrics showed a sudden increase in monthly cancel rate. Teams sprang into action to discover the reason. Here’s a simplified facsimile of the data:
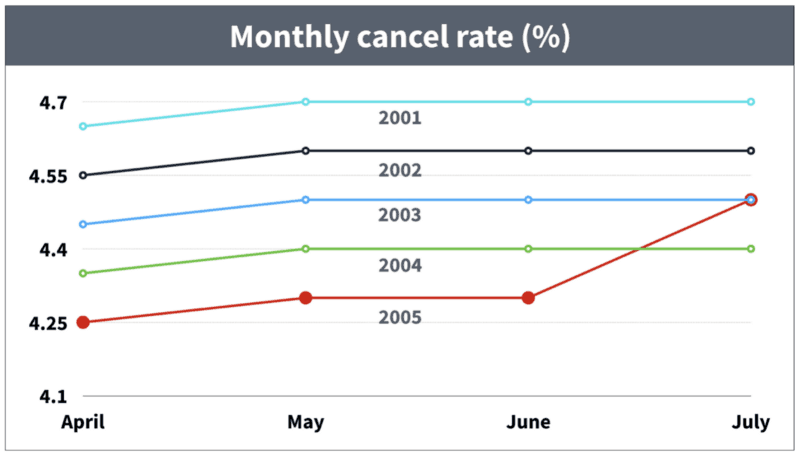
The rise in cancels motivated a fast-paced search to discover what had happened. Was it a data error? Had we implemented a site change with unintended consequences?
After digging in the data, the lead hypothesis was that members canceled as summer approached: they wanted to spend more time outside. But why hadn’t we seen this increase in the past? Was the weather better this year? (No.) Were we reaching a cancel rate plateau? (Unlikely.) I recall being impressed by the increasing number of analysts we threw against the problem — the team’s intellectual curiosity was insatiable.
We solved the mystery the next month. In hindsight, it seems simple, but in the “fog of war” it took a while to bring the issue into focus. In late spring, in each of the past four years, we had lowered prices. This obscured an annual cancel rate increase due to summer weather. 2005 was the first year we had not lowered our price as summer approached.
This exploration of cancel rates helped form a new hypothesis about how to improve retention. While looking at regional data, we noticed a surprisingly fast improvement in cancel rates in Hawaii. Below, I loosely recreate the data for Hawaii, San Jose, and Boise:
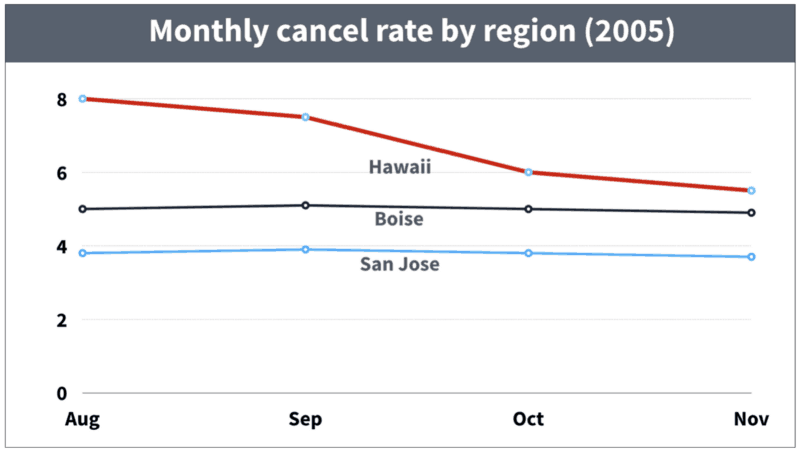
The lowest cancel rate (San Jose) made sense as we had launched the service there first. Boise had launched a few years later and its cancel rate was slowly approaching San Jose’s rate. The surprise was the rate of improvement in Hawaii. Why had it dropped from 8% to less than 6% in less than two months?
The answer was simple. When we first offered the service in Hawaii, we shipped disks from our Los Angeles hub, and the DVDs took three days to arrive. In August, however, we launched a new DVD-by-mail hub in Honolulu. Disk delivery speed improved from three days to overnight and led to lower cancel rates.
We formed a new hypothesis: “Increasing the rate of DVD shipment speed will improve retention.” We also added a new metric to the e-staff metrics: “The percentage of DVDs delivered the next day.” Over the next few years, our operations team expanded our automated DVD delivery system from twenty hubs to the equivalent of one hundred. We also tied our inventory system to the website’s merchandising system and only displayed titles on a member’s site if the DVD was available to ship the next day from that member’s local hub.
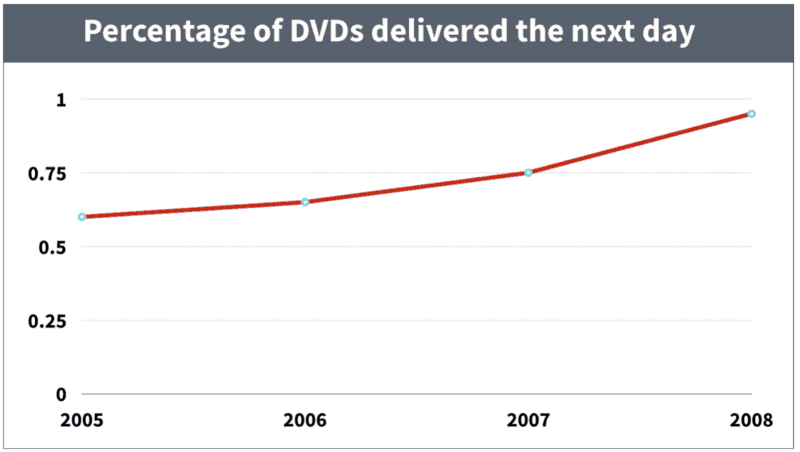
The Hawaii data led us to nation-wide delight through faster DVD delivery. Even better, the expansion of automated operations centers throughout the country improved margin, and the delivery system was extremely hard for Blockbuster to copy. Faster DVD delivery speed achieved the trifecta of delighting customers in hard-to-copy, margin-enhancing ways.

Qualitative Research: Focus groups, one-on-ones, and usability
My first year at Netflix presented another challenge. Reed was an aggressive advocate of the hypothesis that unique movie-finding tools would improve retention by helping customers find movies they love. These tools would also improve margin by merchandising titles with lower licensing fees.
In one previews prototype, members arrived at their homepage, and video previews would automatically begin to play. In another, there was a large play button on the movie display page that members clicked to start a preview.
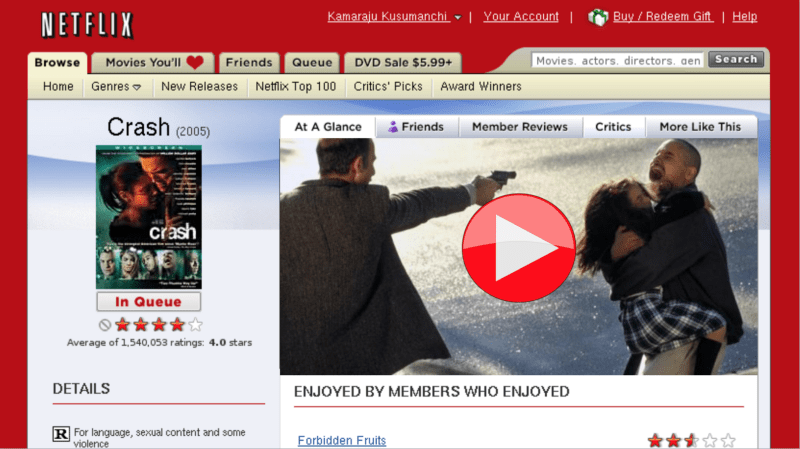
We explored different prototypes in focus groups, but customers were wary. They indicated that the main reason they watched previews was because they were at the theater early to get a good seat — they were a captive audience. Other customers felt that previews revealed too much about the movie.
Reed and I talked about these issues, but he did not want to make a decision based on qualitative. The focus groups were composed of a…
COMMENTS