
The Company Page has a dashboard showing basic page traffic data from the past 30 days: Visitors (how many people navigated to your page, including non-followers) Post impressions (how many people viewed your updates on LinkedIn) Followers (how many people subscribed to receive your updates) This information is useful for getting a quick summary of the past month, but it doesn’t display trends over time. There are three broad data categories: Visitors (data on people who visit your page) Updates (engagement metrics for content posted on LinkedIn) Followers (numerical and demographic information about people who subscribe to your page) Let’s look at these categories in more detail. Traffic metrics By default, this shows your past two weeks of aggregated page traffic data. Metric filter This filter toggles displayed data for Page views and Unique visitors. Update highlights This data measures the previous 30 days of likes, comments, and shares on your page. Followers Here’s where you find out how successful you’ve been in getting people to follow your Company Page, and learn who those people are. It also shows how many followers you’ve gained in the past 30 days, and how that number compares to the previous month. Companies to track This data shows how your LinkedIn profile compares to similar companies operating in your niche. LinkedIn Analytics tools There’s a fair amount of data available in LinkedIn analytics’ default toolkit, but to truly get the most out of your Company Page, you’ll need to use an external analytics tool. Brandwatch Located within the Hootsuite dashboard, Brandwatch is a social listening tool that will zero in on any mention of your company across more than 95 million locations online, including blogs, forums, social networks, news, videos and review sites.

With more than 562 million users in 200 countries around the world, LinkedIn is the world’s premier B2B social network. By publishing press releases, thought leadership articles and other news items to your company page, you can firmly establish your business as an authority. But tracking your LinkedIn analytics is essential for working towards this goal.
You’ll be familiar with some social media metrics on LinkedIn, but probably not all of them. Company pages feature some LinkedIn-specific analytics that you’ll want to familiarize yourself with to maximize your success.
Bonus: Download a free guide to discover four time-saving tools to help you grow your LinkedIn network faster. Includes one tool that lets you schedule a week’s worth of LinkedIn updates in just three minutes.
How to use LinkedIn analytics
To access the LinkedIn analytics dashboard, navigate to toolbar at the top of your company page. You’ll see three options:

Company Page
Page is where you update things like your profile picture and banner (check out our guide for more information on building an optimal Company Page).
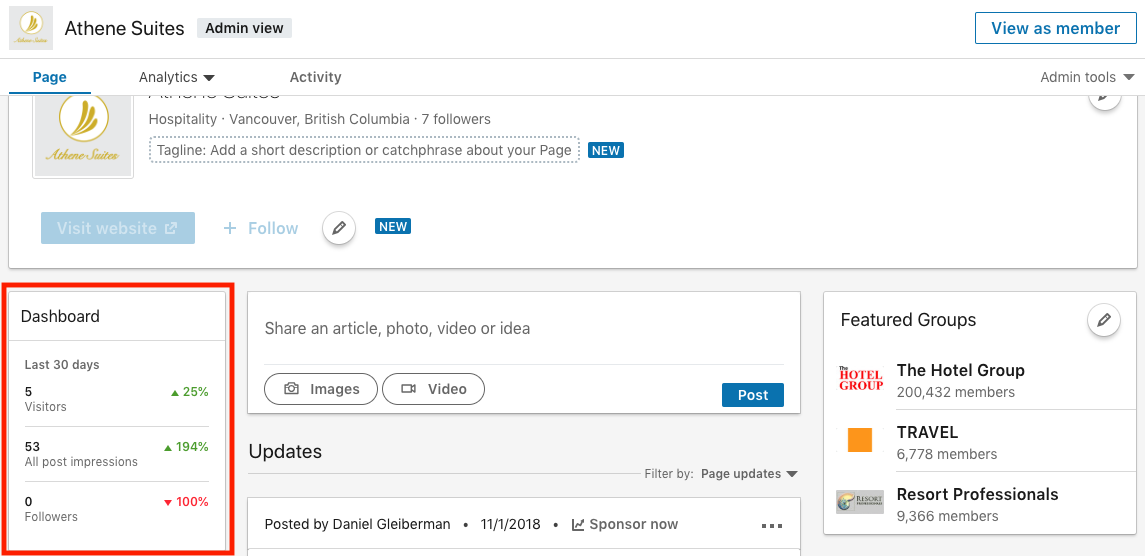
The Company Page has a dashboard showing basic page traffic data from the past 30 days:
- Visitors (how many people navigated to your page, including non-followers)
- Post impressions (how many people viewed your updates on LinkedIn)
- Followers (how many people subscribed to receive your updates)
This information is useful for getting a quick summary of the past month, but it doesn’t display trends over time. To see those, you’ll need to click on the Analytics menu.
Activity dashboard
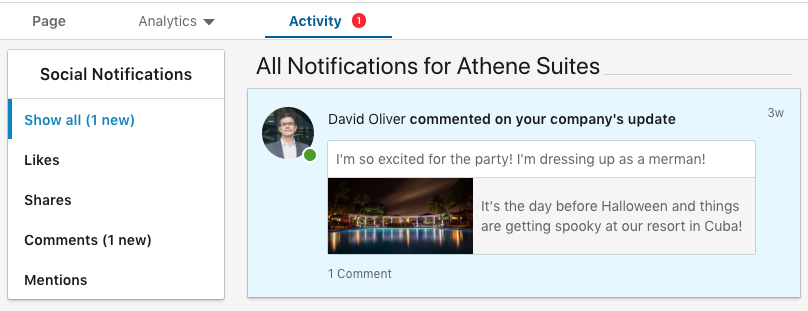
Go to the Activity dashboard for insights on the following metrics:
- Likes
- Shares
- Comments
- Mentions (instances of your brand popping up in conversations online)
Check the Activity page from time to time for qualitative insights into your LinkedIn presence. Reading the comments can help you identify the reasons behind particular data trends.
Analytics dashboard
This is the main area to monitor if you’re looking for deeper insights about your LinkedIn profile. There are three broad data categories:
- Visitors (data on people who visit your page)
- Updates (engagement metrics for content posted on LinkedIn)
- Followers (numerical and demographic information about people who subscribe to your page)
Let’s look at these categories in more detail.
The best LinkedIn metrics to track
Your “best” data in analytics totally depends on the goals you’ve set.
Thinking about hosting a conference in a different city? You may want to check out the Visitors and Subscribers pages to see if your audience is clustered in a particular location.
If you’re experimenting with thought leadership articles, you’ll want to look at Updates. If one article gets above-average interactions, review that piece to figure out why it was so popular.
Let’s check out LinkedIn’s three major analytics categories to learn how all this data can best inform your marketing strategy.
Visitors
Here’s where you can find out who’s visiting your Company Page.
Visitor highlights
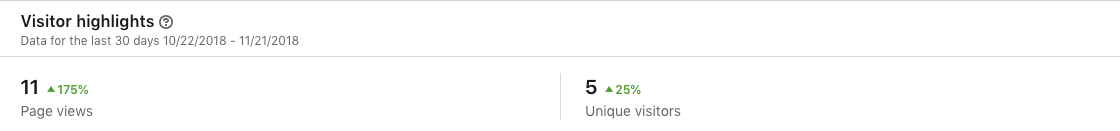
The first analytic you’ll see here is a general overview of Page views and Unique visitors over the past 30 days. Beside each number there’s a percentage showing how much that figure has increased or decreased compared to the same time last month.
Traffic metrics
By default, this shows your past two weeks of aggregated page traffic data. All the page views from anywhere on your profile are added up and averaged out here.
In the center of the Traffic metrics section you’ll see a line graph representing this data.
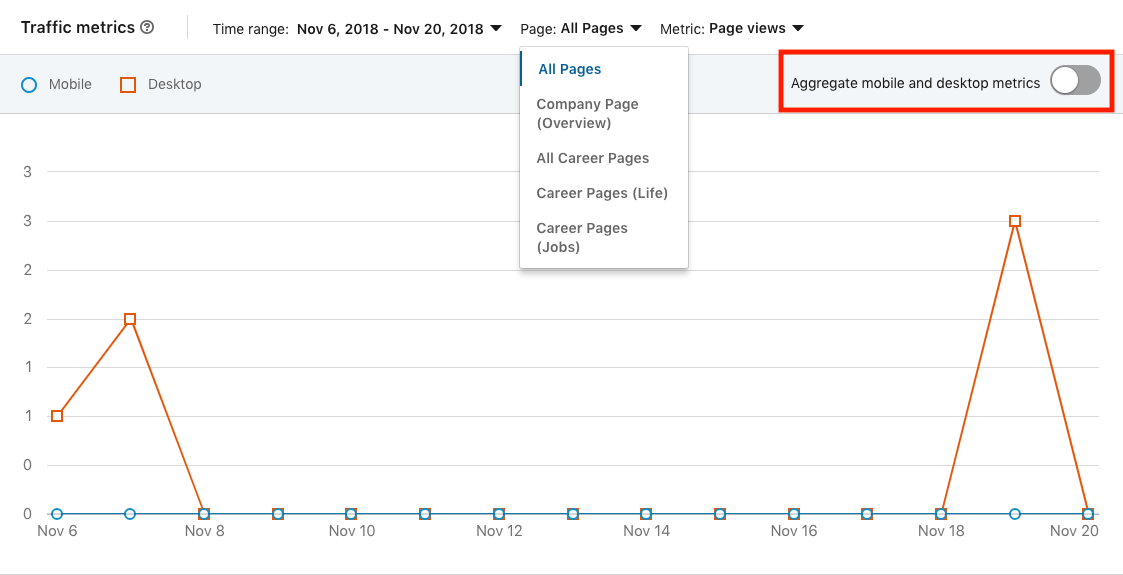
Note that the data here is only accurate up to the previous 24 hours before the last full day. If you’re looking at your traffic metrics at noon on Monday, November 19th, the displayed data will include up to midnight on November 16th.
Traffic metrics graph data is split by device: the blue line represents mobile views while orange is for desktop views. Use the Aggregate mobile and desktop metrics toggle to see the combined results of this data in a single line.
Above this toggle is a toolbar for three data filters: time range, page, and metric.
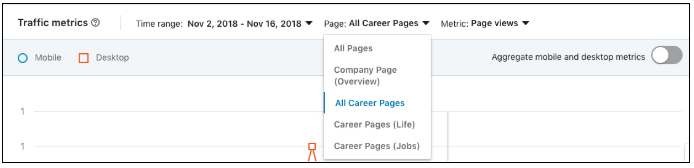
Time range filter
Pretty straightforward: use this filter to isolate data from a particular date and time.
This filter lets you see data from the different pages on your company profile. It offers more granular insights into your page traffic.
Use this data to figure out how to adapt your profile to get more page views—or better yet, increase page views and engagement.
Metric filter
This filter toggles displayed data for Page views and Unique visitors.
Look at Page…
COMMENTS